

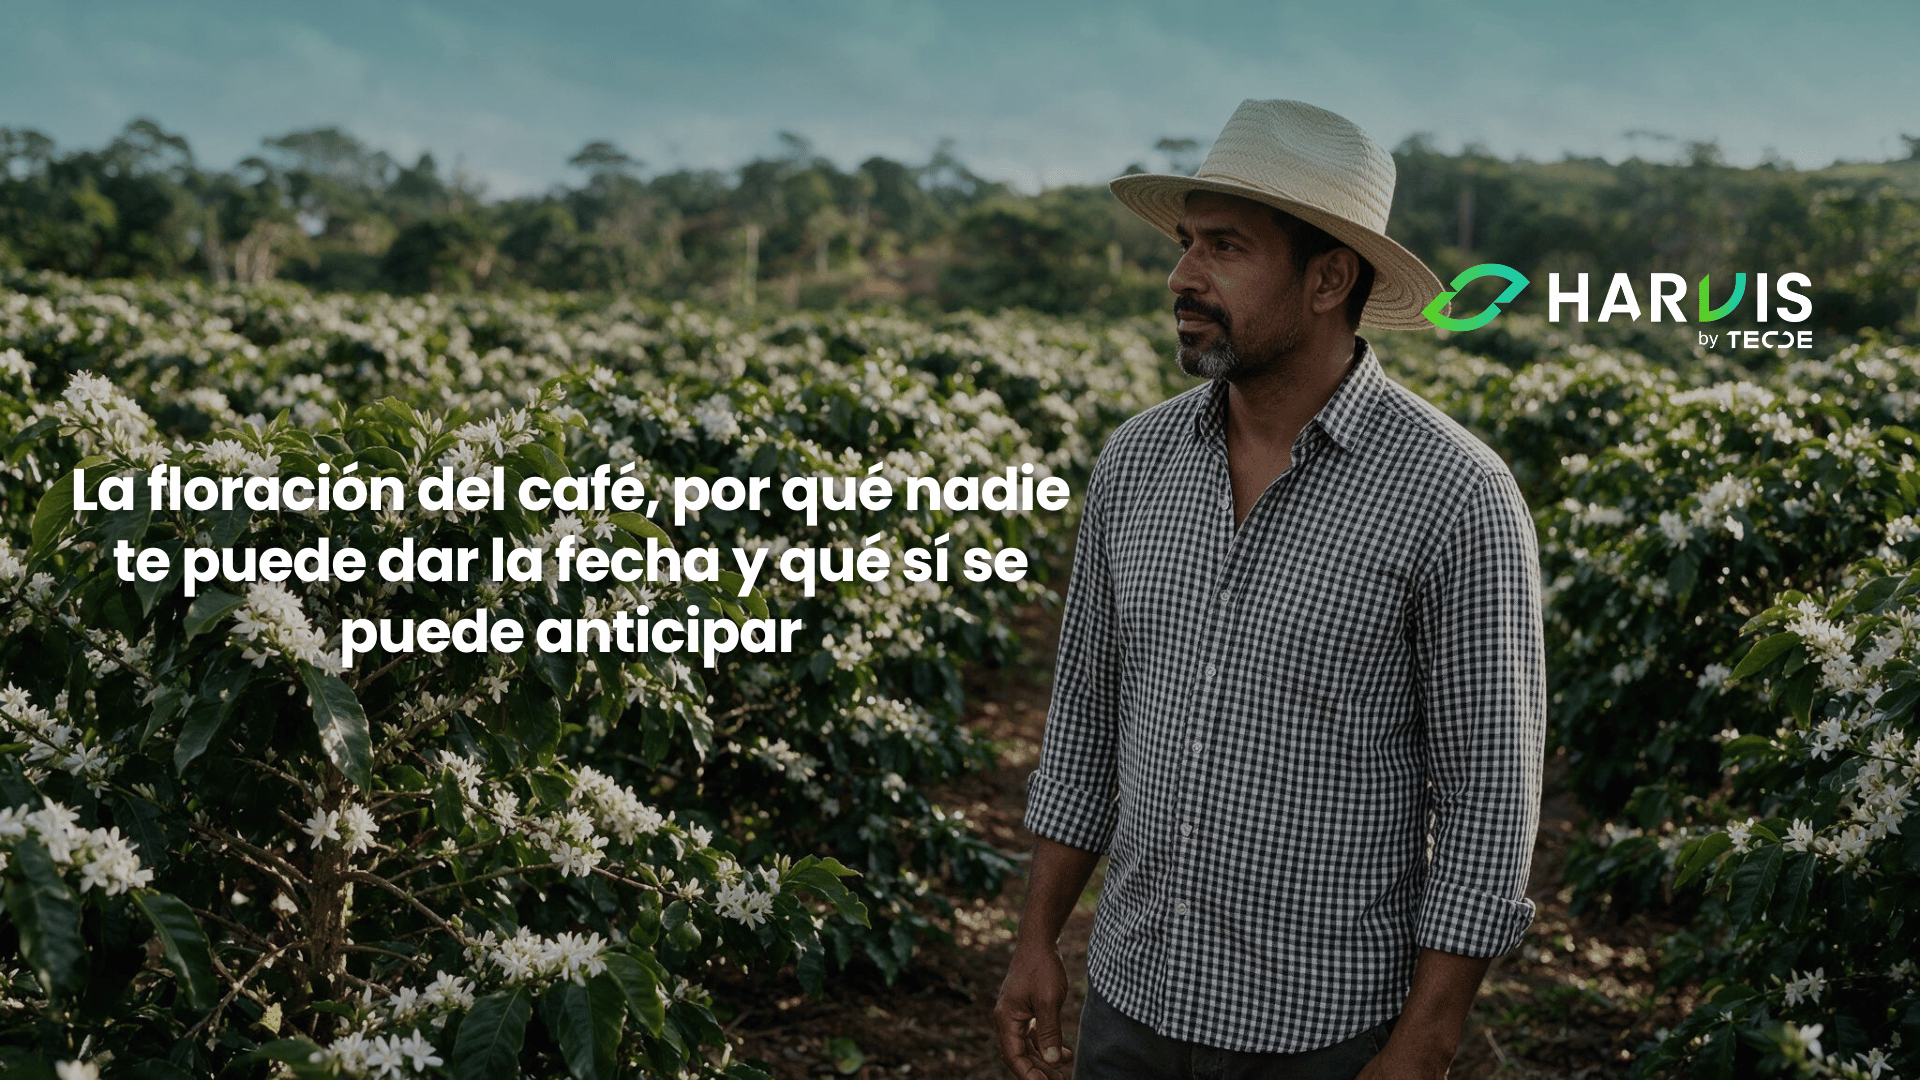
On what date did your main plot flower last year, and on what date the year before? In a commercial coffee plot of the Caturra variety, at 1,250 meters above sea level, followed for three consecutive years, the main flowering came on December 20 the first year, January 28 the second, and February 21 the third. Same plot, same variety, same altitude, and two months of difference between the first year and the last.
That shift comes at a cost. In that same monitoring, rust control had to be brought forward by 60 days the first year, 25 the second, and 8 the third compared with what the fixed calendar indicated. Whoever sprays by calendar in a year with early flowering arrives late, when the plot has already passed the moment to protect it; in a year with late flowering, they arrive too early, to protect leaves and fruits that do not yet exist. And it is not just rust: fertilization, hiring pickers, and, for whoever buys or markets coffee, the week when there will actually be beans to deliver also depend on the flowering date.
Many tools for planning a crop work with accumulated heat, what agronomy knows as growing degree days: the temperature of each day is added up, and when the total reaches a certain figure, the crop moves to the next stage. That calculation is useful for knowing how much time is left once a process has already started, but not for knowing when it will start. And in coffee, flowering is not triggered by heat. In this blog we are going to talk about the three signals that do decide it: light, drought, and the rain that comes after the drought, why none of them can be guessed with a thermometer, and what you can actually record on your farm to stop planning the year blind.
The clock is not started by heat, it is started by light
Coffee is a short-day plant: the bud that will become a flower only begins to form when the day has less than 12 hours of light, and while the day is longer the process is delayed. Lack of water and heat can prevent that start, but they do not bring it forward or push it back; the date is set by day length.
That has a practical consequence. The length of the day on your farm is practically the same every year, because it depends only on where it is located and on the calendar date. From the Coffee Axis toward the north, the day shortens by up to half an hour between June and December, and that small difference weighs more than drought: the flower begins to form four or five months before the major January-to-March flowering periods. In the southern end of the country, in areas such as Nariño, the opposite happens and drought weighs more than light. Up to that point the process is punctual year after year, because it is governed by a clock that does not change. What shifts comes later.
The bud does not grow, it waits, and the wait has no fixed duration
Once formed, the bud grows until it becomes a small cluster of green buttons. When that cluster measures around one centimeter and the buttons separate from one another, growth stops. It is not that something is missing: the flower is already complete inside and ready to open, but it enters rest, what agronomy calls dormancy. A hormone that acts as a brake, abscisic acid, keeps it still, and the bud becomes partially disconnected from the channels that carry water to it, which allows it to withstand drought without dehydrating.
That wait can last between 30 and 120 days, and from the moment the flower begins to form until it comes out of rest, three to five months may pass. That is the underlying reason why accumulated heat does not work for dating flowering. While it waits, a bud may accumulate a certain amount of heat or up to three times more before something wakes it up. A range like that is not a prediction; it is a measure of how long the plant can wait. Before dormancy, heat counts work, and after it too; in between, there is nothing to add up.
That wait has another effect that can be seen in the plot. The buds on the same tree do not move at the same pace, and that is why coffee in the tropics does not flower evenly. But when the signal arrives, the ones that are ready open all at once. The buds become disordered while they wait and are ordered again at the moment of opening, which is why a single rain can produce one large flowering or half a dozen small ones.
What breaks the wait is measured in millimeters, not degrees
What wakes the bud is water. It can come from rain, irrigation, or even fog, and a sudden cooling of about 4 degrees in one hour can also do it. In the field, the two usually arrive together at the end of the dry season, with the so-called flowering rains. A downpour is not necessary: with 5 to 10 millimeters the bud starts growing again, although for a good flowering rains of more than 14 millimeters are cited. As a reference, one millimeter of rain equals one liter of water per square meter of soil. Cenicafé’s criterion describes it from the drought side: flowerings arrive after more than ten days of scant rain, or after two to three weeks without water, followed by isolated rains or strong temperature changes.
But rain does not do the job alone. It only wakes the buds that have already reached dormancy; a bud that was still growing when the drought passed does not respond to water. That is why the number that truly decides the outcome is this: flowering is more even when more than six out of every ten buds are dormant at the moment of rain. The same drought, on a plot where most buds are ready, gives a large flowering; on a delayed plot, it gives a partial flowering and leaves the rest for the next rain. And the worst case is when there is no drought: the buds stay asleep, never open, and end up being lost.
There is a requirement that is almost never mentioned and that changes the reading of a bad year. The bud only responds to rain if the leaves below it are still on the tree. A stripped plot, meaning one that lost a good part of its leaves to rust or to a severe drought, can receive all the flowering rain and still not flower. Water was not lacking; leaves were, and whoever blames the climate in that case is reading the cause incorrectly.
Behind all this there is a hormonal shift. When the plant rehydrates, abscisic acid, the brake hormone, goes down, and ethylene, the signal most associated with flower opening, goes up. As we already covered in our blog Plants do not have a brain, but they do make decisions: the hormonal system that will define your crop’s response to the El Niño event, which you can read here, the plant does not perceive climate directly, but responds through a few hormones. In coffee flowering, that response is a relay between two of them that is triggered by the first rain after drought.
Knowing on what date each plot flowered
Do you have the exact date recorded for when each of your plots flowered this year, and how many millimeters fell in the previous days? On most farms, flowering is remembered by the month and rainfall is not recorded anywhere, so the following year there is nothing to adjust the rust calendar, fertilization, or harvesting with, and everything is done again using the same old dates. Harvis helps you record from your phone the date of each flowering by plot, link it with the rainfall record, note what portion of the buds was ready when the water arrived, and compare years to see how much each plot shifted and in which direction. Write to us and we will set it up on the plots you already have defined.

What can actually be anticipated is a probability, not a date
Once rain wakes the bud, the process becomes predictable again. The bud starts growing in about 48 hours, triples or quadruples in size in the following days, and the flower opens shortly after. In total, between the rain and the day the plot turns white, generally one to two weeks pass, and temperature shortens or lengthens that period: in one trial, at 30 degrees during the day the flower opened eight days after the bud woke up, and at 23 degrees it opened on day eleven, without any drop in the number of flowers.
What cannot be dated months in advance is the rain that wakes it, and for that the right tool is not a calendar but a probability calculation. There is already a model of that kind, built with 53 years of producer records and daily rainfall in Central America, that estimates each year’s flowerings. It does not give a day: it gives how many flowerings are likely and in which time windows, which is exactly the kind of response the phenomenon allows. Its authors even propose it as a basis for agricultural insurance that pays according to how it rains during flowering time.
El Niño, La Niña, and altitude change the shape of flowering
There is one variable that can be forecast months in advance and changes the whole picture: whether the year is coming with El Niño or La Niña. In Colombia’s coffee-growing region, El Niño brings less rain and poorer distribution, and that favors very concentrated and abundant flowerings, because a longer drought leaves more buds ready at the same time and the following rain wakes them all together. La Niña does the opposite: with more rainy days, the buds spend more time asleep, many are lost, and flowerings come out scattered, smaller, and less concentrated. Monitoring of two climate stations in the coffee region between 2011 and 2016 shows this on the calendar: the main flowerings were from November to April, with the peak in March in La Niña years, in November in normal years, and a much higher peak in February in El Niño years.
For whoever organizes harvesting, manages farm accounts, or buys coffee, this matters because what happens in flowering is repeated months later in the harvest. A concentrated flowering signals a concentrated harvest, with lots of beans and a high need for pickers in a few weeks; a spread-out flowering signals several smaller picking rounds over the months.
Excess water also has its own damage. When it rains for a long time, buds that did not get through a clearly defined drought advance and produce star flowers, deformed flowers that do not become fruit. In very rainy areas they can account for between 13 and 18 out of every 100 flowers. The same deformity appears at the opposite extreme, when a weak rain falls in the middle of a long, hot drought. An open flower is not always coffee: an abundant flowering in a very rainy year can bring many flowers that will not produce beans.
Altitude finishes explaining why there is no single calendar. In Colombia, five flowering patterns are recognized according to region, with flowerings between January and March for the main second-semester harvest and between August and October for the first-semester harvest. But above 1,700 meters, flowering is spread across almost the whole year and coffee is produced in a similar way in both semesters, with weak peaks or no peaks at all. A high-altitude plot does not have a flowering date: it has a drip.
Why figures from another farm cannot be copied exactly onto yours
All the figures in this blog come from studies with specific varieties, altitudes, and years, and part of them was measured in growth chambers, not in commercial plots. The probability model, for example, was built for a region with only one rainy season per year, while the Colombian Andean zone has two, so it cannot be transferred without adjustments. And the amount of heat the bud accumulates while it waits changes so much from one study to another that any average would be a made-up number; degree-day models, by how they are built, do not take rainfall or the other factors that rule here into account.
The studies also measure how much thirst the plant must go through for rain to wake it, but that requires instruments that a commercial farm does not have, and even among researchers there is no agreement on the exact value. Counting by eye how many buds are ready is an imperfect substitute, but it is within anyone’s reach. What is worth taking away is not the table of numbers but the procedure: record the date of each flowering, record the rainfall in the previous weeks, and estimate what portion of the buds was ready when the water arrived.
A rain gauge, three dry weeks, and the date when the plot flowered
Everything starts with the cheapest instrument on the farm. Put a rain gauge inside the plot, not in the house yard or next to the storage shed, and read it every day at the same time. Write down the millimeters and write a zero on days when it does not rain, because the zeros are half the data: if you only record rainy days, there is no way later to reconstruct the drought. What you are looking for in that notebook is a dry spell, and when you have about ten days with little or no rain, start watching the plot more closely, because from then on any downpour may be the one that triggers flowering.
Before the water arrives, inspect ten marked trees. What matters is whether the clusters of buttons have already reached the waiting point, and that can be recognized without a magnifying glass: they measure around one centimeter, the buttons are separated from one another, they no longer have the sticky substance from the beginning, and their color is light green. Count on how many nodes of the branches you see that state and on how many you still see the buttons tight and sticky. If most are waiting, you will have a large flowering; if most are delayed, that rain will give you half a flowering and the rest will wait for the next one.
When it rains, record the date, the millimeters, and on the same line the proportion of buds you had counted as ready. Go back to the plot between eight and fifteen days later and record the day you saw it turn white. That pair of dates, the rain date and the flower date, is the data that cannot be recovered afterward, and the one that lets you plan the rest of the year forward.
And before blaming the climate, check the leaves. If the plot had been defoliated by rust or drought, record it. A stripped plot that did not flower did not have a rain problem; it had a leaf problem, and that difference decides whether next year you invest in rust control or simply wait for another rain.
The flower is not driven by heat, it is driven by the drought that comes before
Coffee flowering cannot be placed on the calendar months in advance, and that is not because of a lack of models but because of how the plant works. The start is set by light and falls at almost the same time every year. Then comes a wait that can last from one to four months, during which the plant does not accumulate anything that can be counted. And the trigger is decided by a coincidence: enough drought to leave most of the buds ready and a rain that comes afterward. When that happens, the flower opens in one or two weeks, and from there the rest of the cycle becomes predictable again.
What you can do right now fits into five decisions. Put a rain gauge inside the plot and record the millimeters every day, including zeros. Record the exact date of each flowering for each plot, not the month, because the month is what made you repeat last year’s calendar. Before the first rain after a long drought, count on ten trees how many nodes have ready buds, because that proportion tells you whether a large flowering or several small ones are coming. Record whether the plot had leaves when the water arrived. And when you know whether the year is coming with El Niño or La Niña, use that to expect concentrated or spread-out flowerings, not to expect a date.
The producer who ends the year with the dates of their flowerings and the rain that triggered them will be able to adjust rust control, fertilization, and harvesting plot by plot, and whoever manages the farm or buys the coffee will know in advance when there will be beans. The one who only remembers the month will go back to working by habit and blaming the climate for what was actually a poorly chosen date.
Do you want to have the date of each flowering for each plot together with the rain that triggered it, so you can stop planning the year with last year’s calendar? Write to us on WhatsApp or schedule a demo and we will show you how Harvis turns a rain gauge and a notebook into your farm’s work calendar.
References consulted
- Flowering and Fruiting of Coffea arabica L., A Comprehensive Perspective from Phenology. (2025). Plants, MDPI, 14(21), 3396. https://doi.org/10.3390/plants14213396
- Rivillas O., C. A. (2018). Registro de la floración del café, criterio alternativo para el control de la roya del cafeto en Colombia. Avances Técnicos Cenicafé, 495, 1–8. https://biblioteca.cenicafe.org/bitstream/10778/1105/1/AT0495.pdf
- Inferring multiple coffee flowerings in Central America using farmer data in a probabilistic model. Ecological Informatics. https://www.sciencedirect.com/science/article/pii/S1574954123004636
- Quantification and Qualification of Floral Patterns of Coffea arabica L. in Colombia. (2023). Plants, MDPI, 12(18), 3332. https://doi.org/10.3390/plants12183332
- Fotouo Makouate, H. y Zude-Sasse, M. (2025). Advances in Growing Degree Days Models for Flowering to Harvest, Optimizing Crop Management with Methods of Precision Horticulture, A Review. Horticulturae, MDPI, 11(12), 1415. https://doi.org/10.3390/horticulturae11121415
- Bonhomme, R. (2000). Bases and limits to using degree.day units. European Journal of Agronomy, 13(1), 1–10. https://www.sciencedirect.com/science/article/pii/S1161030100000587
- Arcila-Pulgarín, J. y colaboradores. Application of the extended BBCH scale for the description of the growth stages of coffee. Annals of Applied Biology. https://doi.org/10.1111/j.1744-7348.2002.tb00151.x
- Vélez-Arango, B. E., Jaramillo-Robledo, Á., Chaves-Córdoba, B. y Franco, M. (2000). Distribución de la floración y la cosecha de café en tres altitudes. Avances Técnicos Cenicafé, 272, 1–4. https://doi.org/10.38141/10779/0272
- Calendario para el registro de floración y cosecha. Cenicafé. https://publicaciones.cenicafe.org/index.php/calendario
- Unigarro, C. A., Imbachi, L. C., León-Burgos, A. F., Cayón-Salinas, D. G. y Flórez-Ramos, C. P. Harvest-Dependent Variability in the Ripening and Fruit Characteristics of the Cenicafé 1 Variety of Coffee. Crops, MDPI, 6(4), 75. https://doi.org/10.3390/crops6040075
- Chill topped historical Arabica coffee yield loss among climate stressors in Yunnan, China, followed by drought. (2025). npj Sustainable Agriculture. https://doi.org/10.1038/s44304-025-00092-5
- Variabilidad espacial y temporal de la temperatura del aire en la zona cafetera colombiana. Investigaciones Geográficas, Boletín del Instituto de Geografía. https://doi.org/10.14350/rig.38707
- University of California Statewide IPM Program. Degree-Days, how to calculate and use degree-day models. https://ipm.ucanr.edu/WEATHER/ddconcepts.html
- A comparison of methods to estimate seasonal phenological development from BBCH scale recording. International Journal of Biometeorology. https://doi.org/10.1007/s00484-011-0421-x
- Da Silva Angelo, P. C., Ferreira, I. B., De Carvalho, C. H. S., Matiello, J. B. y Sera, G. H. (2019). Arabica Coffee Fruits Phenology Assessed through Degree Days, Precipitation, and Solar Radiation Exposure on a Daily Basis. International Journal of Biometeorology, 63, 831–843. https://doi.org/10.1007/s00484-019-01693-2
- Effects of sampling methodology on phenology indices, insights from sites across India and modelling. (2025). Journal of Biosciences. https://doi.org/10.1007/s12038-025-00537-z